Four years ago I posted the article, “Cleaning Solar Panels – Does it make much differenceâ€. In that article I calculate the difference between my dirty and clean panels to be only 1.5% efficiency. That number just didn’t *feel* right to me, so I decided to give the process another try.
I proceeded to export the data on output power for each individual solar panel by hour for the middle 15 days of July. I thought this would be a great test since most of the days were very sunny with great output. My goal was to duplicate the process I used before… basically finding 2 panels that had consistently the same output, then clean one of them and compare the difference. Unfortunately, no matter what I did, the data was NEVER consistent. I spent 2 hours exporting data from every minute, 10 minutes, 30 minutes, and hour. I tried exports for various individual days and ranges of days.
The lack of consistency of data was causing me to go INSANE! Not only did two panels have the same output one day, but not the next, there were some days that a pair of panels were in the top 5 performers for a few days, but were in the lower 5 performers another few days. It made absolutely no sense… and still boggles my mind. My only theory is that the TIGO power optimizer are somehow messing with the individual panel outputs to improve the efficiency of the string? I was about to completely give up.
As I sat at my computer, closing out all my excel sheets and deleting all the data export files, I was about to throw in the tower… er… squeegee, but then I had one last idea. “What if I cleaned one entire string of panels and compared the mid-day total output, as a group, to the total output of the other string? My panels are all right next to each other and in the middle of the day they all get equal sunshine.
I’m VERY pleased with the results!
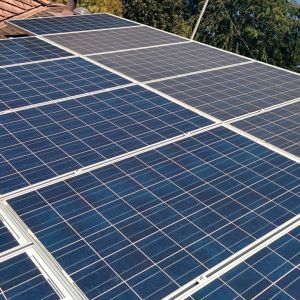
Here’s a pic of 9 clean and 9 dirty panels (two separate strings):

Here’s the average peak output per-panel for each string:
All Panels Dirty:
7/25/2016 – String 1: 165.11 Watts
7/25/2016 – String 2: 165.68 Watts
String 1 = -0.3% more efficient than String 2
7/27/2016 – String 1: 154.00 Watts
7/27/2016 – String 2: 152.93 Watts
String 1 = 0.7% more efficient than String 2
As you can see, the difference in output for these strings is negligible.
On the end of the day (sunset) I cleaned String 1 and pulled up my output for the middle of the day and it was immediately clear that the 1st string was outperforming the 2nd string:
First, here’s what the output looks like on a great day’s peak output when all the panels were dirty. You’ll notice that the panels in the 1st and 2nd string look pretty similar.
 … now check out what the two strings look like when the 1st string is clean:

Wow! It’s pretty obvious that the 1st string is performing WAY better than the 2nd string!
After Cleaning String 1:
7/28/2016 – String 1: 167.80 Watts
7/28/2016 – String 2: 154.64 Watts
String 1 = 8.5% more efficient than String 2
7/31/2016 – String 1: 166.76 Watts
7/31/2016 – String 2: 154.30 Watts
String 1 = 8.1% more efficient than String 2
When I run the data, I consistently get 8% – 8.5% more efficiency with the clean string of panels! In fact, my total output over the past 4 months has barely reached 3kW, but today I peaked out at 3.26kW!

Now I’m convinced I should make sure I give the panels a nice cleaning at the beginning of the summer!
hii,
What is the better way to clean solar panels?
Here’s some info on tools I used to clean my panels: http://www.nifty-stuff.com/cleaning-solar-panels-ii-tools.php